
What these statistics cover
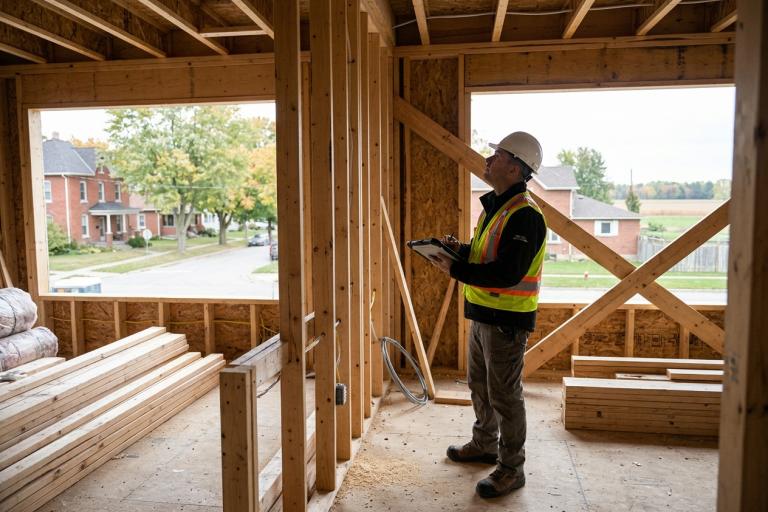
The City of Wrenford tracks the number of building permits issued each month and year. We also compare this data to the previous year so you can see how construction activity is changing. The data covers all property types. Within each category, we break the numbers down into new construction, additions, and alterations and repairs.
Download the reports
You can view the latest monthly and annual reports as PDF files. Each file is under 200 KB and can be downloaded below.
2026 Monthly Reports
- January 2026
- February 2026
- March 2026
- April 2026
- May 2026
- June 2026
- July 2026
- August 2026
- September 2026
2025 Annual Summary
- 2025 Annual Building Permit Summary (1,840 permits issued)
2024 and Older Reports
- 2024 Annual Summary
- 2023 Annual Summary
- 2022 Annual Summary
- 2021 Annual Summary
- 2020 Annual Summary
- 2019 Annual Summary
Important notes
- The monthly statistics for January through July 2021 were updated on November 1, 2021, to correct a data entry error.
- Data is collected from the first day of the month to the last day.
- For a broader view of housing and development, visit our Statistics page.
Need help with the data?
If you need help understanding the reports or want to request a custom breakdown, contact the Planning and Development department. You can email [email protected] or call 519-555-0100.